“2016 was a transformational year for Smart Sand,” stated
Full Year 2016 Highlights
Revenues were
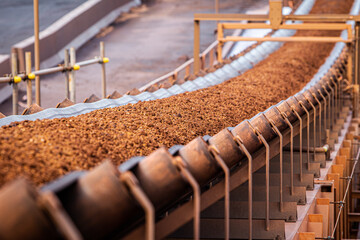
Overall tons sold were approximately 826,400 in the full year 2016, compared with approximately 750,700 tons sold in the full year 2015, a 10% increase year over year.
Net income was
Adjusted EBITDA was
Fourth Quarter 2016 Highlights
Revenues were
Overall tons sold were approximately 274,500 in the fourth quarter of 2016, compared with approximately 107,200 tons sold in the fourth quarter of 2015 and 229,700 tons for the third quarter of 2016, increases of 156% and 19%, respectively.
The Company generated net income of
Adjusted EBITDA was
Additionally, for the first two months of 2017 we sold approximately 331,000 tons.
Capital Expenditures
Smart Sand’s capital expenditures totaled
Conference Call
Forward-looking Statements
All statements in this news release other than statements of historical facts are forward-looking statements which contain our current expectations about our future results. We have attempted to identify any forward-looking statements by using words such as "expect", “will”, “estimate” and other similar expressions. Although we believe that the expectations reflected, and the assumptions or bases underlying our forward-looking statements are reasonable, we can give no assurance that such expectations will prove to be correct. Such statements are not guarantees of future performance or events and are subject to known and unknown risks and uncertainties that could cause the Company's actual results, events or financial positions to differ materially from those included within or implied by such forward-looking statements.
Factors that could cause our actual results to differ materially from the results contemplated by such forward-looking statements include, but are not limited to the factors discussed or referenced in the “Risk Factors” section of the prospectus (the “Prospectus”), filed by the Company with the
You should not place undue reliance on our forward-looking statements. Any forward-looking statement speaks only as of the date on which such statement is made, and we undertake no obligation to publicly update or revise any forward-looking statement, whether as a result of new information, future events, changed circumstances or otherwise, unless required by law.
About
| CONDENSED CONSOLIDATED STATEMENTS OF OPERATIONS | ||||||||||||
| Three Months Ended | ||||||||||||
| December 31, 2016 | September 30, 2016 | December 31, 2015 | ||||||||||
| (in thousands, except per share amounts) | ||||||||||||
| Revenues | $ | 29,450 | $ | 10,927 | $ | 15,165 | ||||||
| Cost of goods sold | 8,770 | 5,931 | 3,867 | |||||||||
| Gross profit | 20,680 | 4,996 | 11,298 | |||||||||
| Operating expenses: | ||||||||||||
| Salaries, benefits and payroll taxes | 3,774 | 1,316 | 1,064 | |||||||||
| Depreciation and amortization | 101 | 102 | 112 | |||||||||
| Selling, general and administrative | 1,532 | 1,044 | 1,077 | |||||||||
| Total operating expenses | 5,407 | 2,462 | 2,253 | |||||||||
| Operating income | 15,273 | 2,534 | 9,045 | |||||||||
| Other (expenses) income: | ||||||||||||
| Preferred stock interest expense | (629 | ) | (1,813 | ) | (1,388 | ) | ||||||
| Other interest expense | (345 | ) | (845 | ) | (1,124 | ) | ||||||
| Other income | 8,638 | 33 | (7 | ) | ||||||||
| Total other expenses, net | 7,664 | (2,625 | ) | (2,520 | ) | |||||||
| Loss on extinguishment of debt | 1,051 | — | 2,594 | |||||||||
| (Loss) income before income tax expense (benefit) | 21,886 | (91 | ) | 3,931 | ||||||||
| Income tax expense (benefit) | 9,445 | 5 | 4,260 | |||||||||
| Net (loss) income | $ | 12,441 | $ | (96 | ) | $ | (329 | ) | ||||
| Net (loss) income per common share: | ||||||||||||
| Basic | $ | 0.40 | $ | (0.00 | ) | $ | (0.01 | ) | ||||
| Diluted | $ | 0.40 | $ | (0.00 | ) | $ | (0.01 | ) | ||||
| Weighted-average number of common shares: | ||||||||||||
| Basic | 30,952 | 22,189 | 22,114 | |||||||||
| Diluted | 31,210 | 22,189 | 26,400 | |||||||||
| Year Ended December 31, | ||||||||
| 2016 | 2015 | |||||||
| (in thousands, except per share amounts) | ||||||||
| Revenues | $ | 59,231 | $ | 47,698 | ||||
| Cost of goods sold | 26,569 | 21,003 | ||||||
| Gross profit | 32,662 | 26,695 | ||||||
| Operating expenses: | ||||||||
| Salaries, benefits and payroll taxes | 7,385 | 5,055 | ||||||
| Depreciation and amortization | 384 | 388 | ||||||
| Selling, general and administrative | 4,502 | 4,669 | ||||||
| Total operating expenses | 12,271 | 10,112 | ||||||
| Operating income | 20,391 | 16,583 | ||||||
| Other (expenses) income: | ||||||||
| Preferred stock interest expense | (5,565 | ) | (5,078 | ) | ||||
| Other interest expense | (2,862 | ) | (2,748 | ) | ||||
| Other income | 8,860 | 363 | ||||||
| Total other income (expenses), net | 433 | (7,464 | ) | |||||
| Loss on extinguishment of debt | (1,051 | ) | — | |||||
| Income before income tax expense | 19,773 | 9,119 | ||||||
| Income tax expense | 9,394 | 4,129 | ||||||
| Net income | $ | 10,379 | $ | 4,990 | ||||
| Net income per common share: | ||||||||
| Basic | $ | 0.43 | $ | 0.23 | ||||
| Diluted | $ | 0.42 | $ | 0.19 | ||||
| Weighted-average number of common shares: | ||||||||
| Basic | 24,322 | 22,114 | ||||||
| Diluted | 24,579 | 26,400 | ||||||
| CONDENSED CONSOLIDATED BALANCE SHEETS | ||||||||
| December 31, 2016 |
December 31, 2015 |
|||||||
| (in thousands) | ||||||||
| Assets | ||||||||
| Current assets: | ||||||||
| Cash | $ | 46,563 | $ | 3,896 | ||||
| Restricted cash | 971 | — | ||||||
| Accounts receivables, net | 5,339 | 2,020 | ||||||
| Unbilled receivables | 404 | 4,021 | ||||||
| Inventories | 10,344 | 5,025 | ||||||
| Prepaid expenses and other current assets | 1,403 | 1,524 | ||||||
| Total current assets | 65,024 | 16,486 | ||||||
| Inventories, long-term | 3,155 | 7,117 | ||||||
| Property, plant and equipment, net | 104,096 | 108,928 | ||||||
| Deferred financing costs, net | 1,154 | — | ||||||
| Other assets | 23 | 33 | ||||||
| Total assets | $ | 173,452 | $ | 132,564 | ||||
| Liabilities and Stockholders’ Equity | ||||||||
| Current liabilities: | ||||||||
| Accounts payable | $ | 1,663 | $ | 1,170 | ||||
| Accrued and other expenses | 2,430 | 3,778 | ||||||
| Deferred revenue | 1,615 | 7,133 | ||||||
| Income taxes payable | 7,058 | - | ||||||
| Current portion of equipment financing obligations | 674 | 409 | ||||||
| Current portion of notes payable | 282 | 1,369 | ||||||
| Redeemable Series A preferred stock | — | 34,708 | ||||||
| Total current liabilities | 13,722 | 48,567 | ||||||
| Revolving credit facility, net | — | 62,768 | ||||||
| Equipment financing obligations, net of current portion | 572 | 1,246 | ||||||
| Notes payable, net of current portion | 288 | 569 | ||||||
| Deferred tax liabilities, long-term, net | 15,044 | 14,505 | ||||||
| Asset retirement obligation | 1,384 | 1,180 | ||||||
| Total liabilities | 31,010 | 128,835 | ||||||
| Stockholders’ equity | ||||||||
| Common stock | 39 | 22 | ||||||
| Treasury stock, at cost | (539 | ) | (123 | ) | ||||
| Additional paid-in capital | 132,879 | 4,146 | ||||||
| Accumulated deficit | 10,063 | (316 | ) | |||||
| Total stockholders’ equity | 142,442 | 3,729 | ||||||
| Total liabilities and stockholders’ equity | $ | 173,452 | $ | 132,564 | ||||
Non-GAAP Financial Measures
EBITDA and Adjusted EBITDA
We define EBITDA as our net income, plus (i) depreciation, depletion and amortization expense; (ii) income tax expense (benefit); (iii) interest expense and (iv) franchise taxes. We define Adjusted EBITDA as EBITDA, plus (i) gain or loss on sale of fixed assets or discontinued operations, (ii) costs related to our initial public offering (“IPO”), (iii) restricted stock compensation; (iv) development costs; (v) non-recurring cash charges related to restructuring, retention and other similar actions, (vi) one-time integration and transition costs associated with specified transactions, including our IPO, (vii) earn-out and contingent consideration obligations, and (viii) non-cash charges and unusual or non-recurring charges. Adjusted EBITDA is used as a supplemental financial measure by management and by external users of our financial statements, such as investors and commercial banks, to assess:
- the financial performance of our assets without regard to the impact of financing methods, capital structure or historical cost basis of our assets;
- the viability of capital expenditure projects and the overall rates of return on alternative investment opportunities; and
- our ability to incur and service debt and fund capital expenditures; and our operating performance as compared to those of other companies in our industry without regard to the impact of financing methods and capital structure.
We believe that our presentation of EBITDA and Adjusted EBITDA will provide useful information to investors in assessing our financial condition and results of operations. Net income is the GAAP measure most directly comparable to EBITDA and Adjusted EBITDA. EBITDA and Adjusted EBITDA should not be considered alternatives to net income presented in accordance with GAAP. Because EBITDA and Adjusted EBITDA may be defined differently by other companies in our industry, our definition of EBITDA and Adjusted EBITDA may not be comparable to similarly titled measures of other companies, thereby diminishing its utility.
The following table presents a reconciliation of EBITDA and Adjusted EBITDA to net income (loss) for each of the periods indicated:
| Three Months Ended | |||||||||||
| December 31, 2016 | September 30, 2016 | December 31, 2015 | |||||||||
| (in thousands) | |||||||||||
| Net (loss) income | $ | 12,441 | $ | (96 | ) | $ | 2,266 | ||||
| Depreciation, depletion and amortization | 1,624 | 1,647 | 1,561 | ||||||||
| Income tax expense (benefit) | 9,445 | 5 | 4,260 | ||||||||
| Interest expense | 983 | 2,658 | 2,512 | ||||||||
| Franchise taxes | 2 | 3 | 6 | ||||||||
| EBITDA | $ | 24,495 | $ | 4,217 | $ | 10,605 | |||||
| Gain (loss) on sale of fixed assets (1) | - | 29 | 84 | ||||||||
| Initial public offering related costs (2) | 725 | - | 38 | ||||||||
| Restricted stock compensation (3) | 706 | 299 | 181 | ||||||||
| Development costs (4) | - | - | 47 | ||||||||
| Non-cash charges (5) | 3 | (8 | ) | (16 | ) | ||||||
| Loss on extinguishment of debt (6) | 1,051 | - | - | ||||||||
| Adjusted EBITDA | $ | 26,980 | $ | 4,537 | $ | 10,939 | |||||
| (1) Includes losses related to the sale and disposal of certain assets in property, plant and equipment. | |||||||||||
| (2) For the year ended December 31, 2016, the Company incurred $725 of IPO related bonuses. For the year ended December 31, 2015, the Company incurred $221 of expenses related to previous IPO activities. | |||||||||||
| (3) Represents the non-cash expenses for stock-based awards issued to our employees and outside directors. | |||||||||||
| (4) Represents costs incurred with the development of certain Company assets. | |||||||||||
| (5) Represents accretion of asset retirement obligation and loss on derivatives. For the years ended December 31, 2016 and 2015, the Company incurred a loss of $5 and $445, respectively, related to a propane derivative contract. | |||||||||||
| (6) Reflects the loss on extinguishment of debt related to our November 2016 financing transaction. | |||||||||||
| Year Ended December 31, | |||||||||
| 2016 | 2015 | ||||||||
| (in thousands) | |||||||||
| Net Income | $ | 10,379 | $ | 4,990 | |||||
| Depreciation and depletion | 6,445 | 5,243 | |||||||
| Income tax expense | 9,394 | 4,129 | |||||||
| Interest expense | 8,436 | 7,826 | |||||||
| Franchise taxes | 21 | 35 | |||||||
| EBITDA | $ | 34,675 | $ | 22,223 | |||||
| Gain (loss) on sale of fixed assets (1) | (59 | ) | 39 | ||||||
| Initial public offering related costs (2) | 725 | 221 | |||||||
| Restricted stock compensation (3) | 1,426 | 792 | |||||||
| Development costs (4) | - | 76 | |||||||
| Non-cash charges (5) | 21 | 530 | |||||||
| Loss on extinguishment of debt (6) | 1,051 | - | |||||||
| Adjusted EBITDA | $ | 37,839 | $ | 23,881 | |||||
| (1) Includes losses related to the sale and disposal of certain assets in property, plant and equipment. | |||||||||
| (2) For the year ended December 31, 2016, the Company incurred $725 of IPO related bonuses. For the year ended December 31, 2015, the Company incurred $221 of expenses related to previous IPO activities. | |||||||||
| (3) Represents the non-cash expenses for stock-based awards issued to our employees and outside directors. | |||||||||
| (4) Represents costs incurred with the development of certain Company assets. | |||||||||
| (5) Represents accretion of asset retirement obligation and loss on derivatives. For the years ended December 31, 2016 and 2015, the Company incurred a loss of $5 and $445, respectively, related to a propane derivative contract. | |||||||||
| (6) Reflects the loss on extinguishment of debt related to our November 2016 and March 2014 financing transactions, respectively. | |||||||||
Investor ContactsLee Beckelman CFO (281) 231-2660 LBeckelman@smartsand.comPhil Cerniglia Investor Relations and Budgeting Manager (281) 231-2660 PCerniglia@smartsand.com
Smart Sand, Inc.